


We Found the Ancestor of Our Bonus Depreciation Calculator


The Bonus depreciation calculator did not start with the internet. We went looking for the earliest version of a bonus depreciation calculator we could find. We didn't expect to end up in 1980’s.
Check out this vintage software, HyperCard.
The Software That Looked Like a Document
Apple released HyperCard in 1987. It let anyone, not just programmers, build small interactive tools called "stacks." Each stack was a deck of cards. Each card could hold text, buttons, and simple logic.
That idea sounds obvious now. In the 80’s, it was not. HyperCard turned "build your own software" into something a small business owner could actually do on a weekend.
“HyperCard is a new format in between application and document. They’re bound together as interactive information.” -Bill Atkinson (Creator of HyperCard released by Apple in 1987)
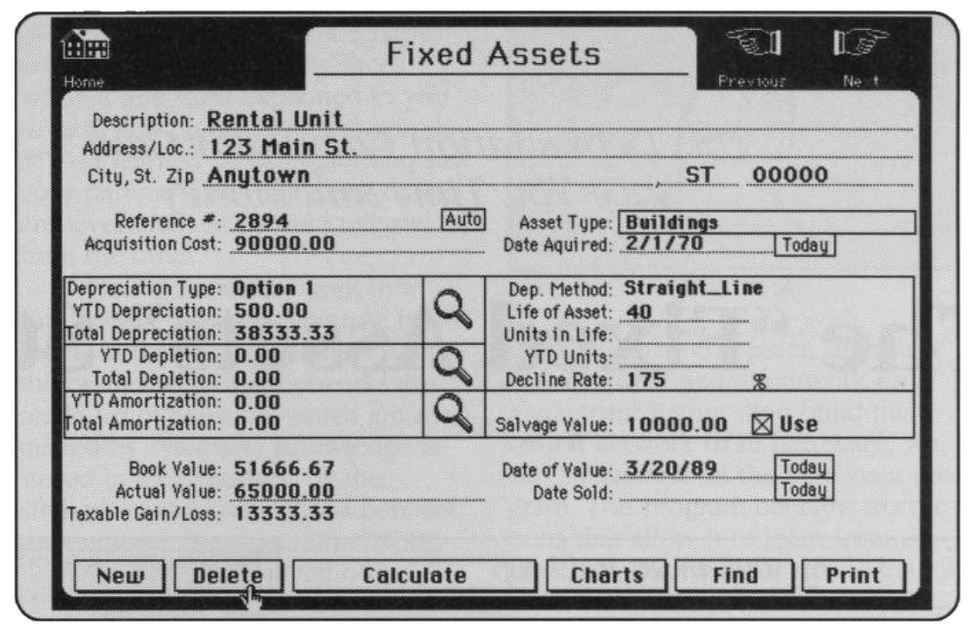
The “Fixed Assets” Stack

The stack was called "Fixed Assets," credited to developer William K. Balthrop. It did real accounting work:
Depreciation scheduling. It generated full depreciation tables so businesses could match asset costs to the years those assets actually earned revenue.
Multiple methods. It handled straight-line depreciation, spreading cost evenly over an asset's life, and accelerated methods like declining balance, which front-load the deduction into the early years.
Salvage value. It subtracted estimated residual value from the purchase price to find the real depreciable base, the same core idea that still drives every depreciation calculation today.
A visual ledger. Every asset got its own card: acquisition date, department, serial number, projected depreciation. HyperCard's card metaphor made a spreadsheet feel like a filing cabinet you could actually flip through.
Cards, Not Cells
By the mid-1980’s, spreadsheets were already the standard way to run this math. You'd put your asset cost in one cell, your useful life in another, and write a formula referencing both. Change a number anywhere in the chain, and every dependent cell updates.
That's the whole model... a flat plane of cells, connected by formulas.
HyperCard did the same job differently. Instead of a grid, you got a stack of cards, one per asset. Instead of a formula referencing a cell address, HyperTalk scripts read almost like plain English (put the depreciation rate into total, rather than =B20.2*). Click into an asset's card and you weren't looking at a row in a table.
Neither method really sped up the math itself. A spreadsheet encourages you to view everything as a cohesive system, with each asset represented as a row in a single table. On the other hand, HyperCard lets you treat each asset as its own individual object, allowing you to click through, edit it on its own terms, and grasp it in isolation before you zoom out to see the bigger picture.

Same Problem, Very Different Depreciation Calculator
Real estate investors today have the same question those 1989 users had. Will this asset's depreciation actually move the needle on what I owe?
The tool looks nothing alike. No stacks, no cards, no floppy disks. But the job is identical: turn a set of numbers into a clear answer, fast enough to actually use before you make a decision.
Our Bonus Depreciation Calculator runs that same math today, built for 100% bonus depreciation under the OBBBA and tuned specifically for real estate instead of generic equipment. Different decade, different platform, same instinct… give people a fast, clear answer instead of a week of waiting on a spreadsheet.
Back in the day a developer was trying to solve the exact same problem we had, with the best tool he had. Figured that deserved a mention.


Comments